Learn how to use Pinterest analytics to understand your audience and increase traffic to your website.
Before we dig into your Pinterest analytics, tell me, have you fallen into the trap of focusing on your MONTHLY VIEWS? Pinterest makes that number seem so important, don’t they? First of all, it’s right there in your face when you look at your account. Second, it’s typically a high number (i.e. 100K+) so that must be good, right? Well, yes and no.
To clarify this off the bat, impressions and monthly views only count how many times a pin, that leads to any of your claimed websites, shows up in a feed. Meaning, someone could’ve been scrolling through the discovery feed or their search results and they rolled right past your pin. No click, no save, no engagement whatsoever. So, you see, this stat doesn’t do a whole lot for you.
(Okay, quick side note… If you are seeing your impressions and views increase, this IS showing you that Pinterest values your content enough to push it out there more. HOWEVER, don’t freak out when you see this number dip. It is totally NORMAL for this number to fluctuate month to month or during certain seasons of the year. Just focus on pinning fresh, high-quality content. Consistently.)
Now let’s get to the good stuff.
You are probably wondering, “If I shouldn’t focus on impressions or monthly views, what should I focus on?” Well, think about your ultimate goal with Pinterest. You want to bring more traffic to your website/blog/online shop so you can convert them into leads/subscribers/customers. Right? So, the stats you should focus on are the ones that measure that. Let me break it down. *Note* This tutorial is for reviewing your analytics on desktop. Stay tuned for a separate tutorial if you prefer to look at the analytics on the mobile app.
Your audience insights and engagements
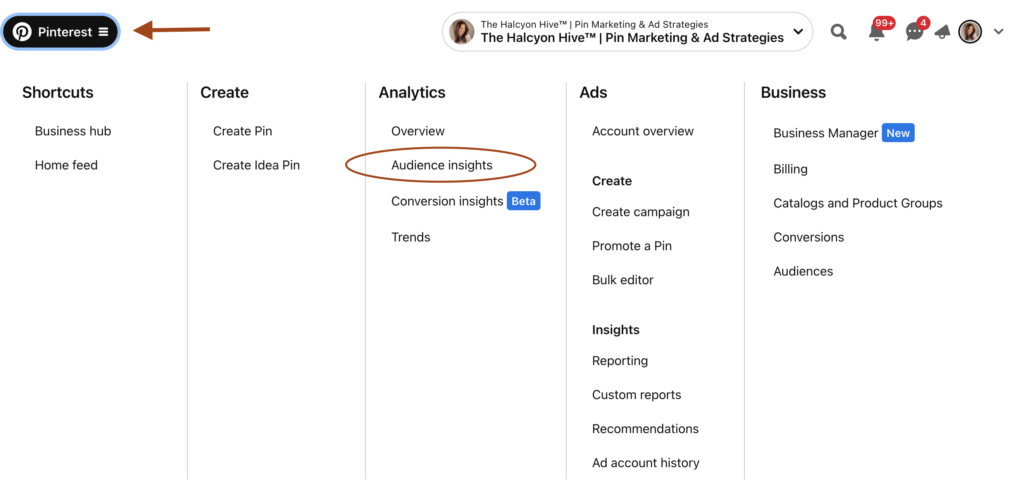
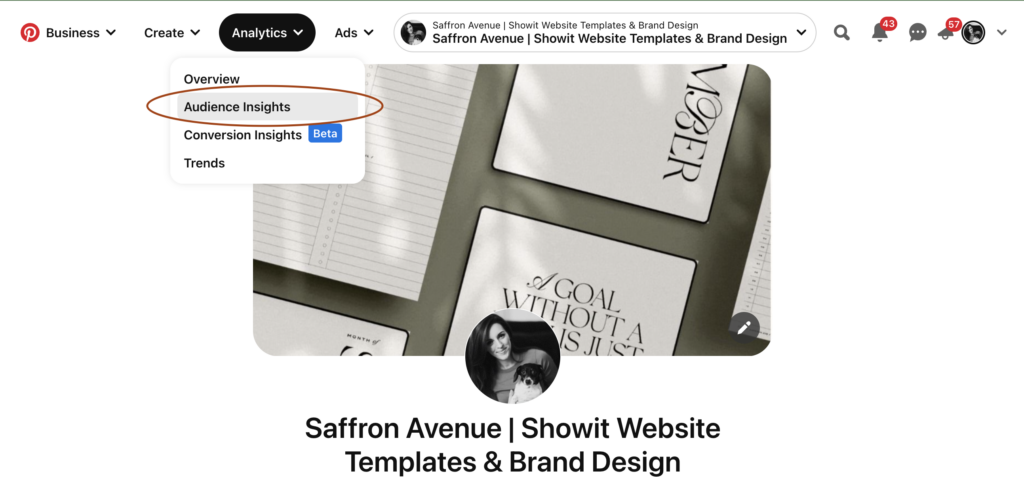
Have you ever looked at your audience insights? This tool can tell you if you are reaching the right audience with your content. You can locate this report up at the top left, under the “Analytics” tab.


Your audience insights will show you quite a bit of valuable info about your audience, from demographic information, age/gender, the device they use, and most importantly, their interests.
The categories and interests can be hard to wrap your head around so I’ll walk you through how I look at it.

Pinterest will default to sorting the categories by “Affinity” which is how I like to view it too. Affinity is the measurement of how interested your audience is in a particular topic compared to the rest of Pinterest users. If the category with the highest affinity is aligned with your niche, then you have built and attracted the right audience here on Pinterest. If it doesn’t, then it probably means you have boards that are unrelated to your niche (i.e. recipe boards but you are a web designer) and that is the content people are engaging with. *Note – Don’t be surprised if your top categories are Finance or Education if you are in marketing or coaching industry. Pinterest currently doesn’t have a “Business” or “Marketing” category, so this is where it ends up.
TIP: Move any boards that are unrelated to your niche to secret so you can still access them. OR better yet, keep a personal account for your non-business content. Focus on creating and pinning to a variety of boards relating to what your ideal audience would be searching for.
It takes time to curate your ideal audience so I will generally only look at my audience insights once every month or even once a quarter.
Monthly Views
Previously, you may remember seeing “Monthly Viewers” on the main page of your Pinterest account. It reported how many people saw your pins in the last 30 days. This has been updated to report “Monthly Views” now and it represents the number of impressions, or times your Pins were on screen, in the last 30 days. This includes Pins you’ve published as well as Pins others have saved from your claimed domain or accounts (YT, Etsy, IG, and verified domains).
Analytics Overview
Next up, let’s look at your Account Overview. Click on “Analytics”, then “Overview”.


2023 update: “Organic Pins are now grouped by format (image, video, or product) rather than Pin type. All organic Idea Pins created before 8/7/2023 are a video Pin format. Single-image Idea Pins created on or after 8/7/2023 are an image format.”
Pinterest Analytics
Set your filters to what you want to look at.
Date Range: You can choose any of the pre-selected timeframes or you can set a custom range. I typically look at the last 30 days or choose a custom range for the previous month when I sit down to review my previous month’s stats at the start of every month.
Content Type: Feel free to leave this set to “All” if you haven’t run any promoted pins in the past. If you have, then you will want to look at just “organic”, “Paid and earned”, or “All” split by content type.
More Filters: Instead of having the filters visible on the left-hand side, you will now find them by clicking “More Filters” . Select the filters you’ll like to use and click apply.

Claimed Account: Look at each of your claimed accounts separately or select “All Pins” to see data for everything that you’ve published. Make sure you claim all accounts & websites that you pin to! (i.e. Any of your own websites, Etsy, Instagram (this option went away but I’ve seen it back on some accounts), and YouTube). The “Other Pins” category are pins that you have saved or published that don’t link to your claimed account. Usually, I will only select my website URL, but it’s good to compare it to the “Other Pins” too since that could tell you if it’s external pins driving the engagement on your account or your own.
Now once you have your filters set you can look at a few different things. Here is a breakdown of what I look at:

Engagements – This is the total of Pin Clicks (frmly Close-ups), Saves, and Outbound Clicks. Engagements are important because it means your pin stopped them in their scroll. (Well done, friend!)
Next, I like to break it down to see each of those categories within Engagements.
Pin Clicks – (formerly called Close-ups) This is when someone clicks a pin for a close-up. If this number is high, it means people are interested in your Pins but wanted to get a closer look or read the description. TIP: Make sure you have a strong CTA on the image and in the description.
Saves – This shows that people are interested in your pin/content but don’t necessarily need it right now. TIP: Select “Saves” from the drop-down menu at the “Top Pins” section in your Pinterest analytics. Click on a few of your top pins, then click “See More Stats” up at the top. Take a look at boards people are pinning it to. If they are relevant boards (aka your target audience) that’s great! See what other types of content they are pinning to give you ideas for new content.
Outbound Clicks – (Formerly Link Clicks) This is your ultimate goal with your pins on Pinterest. You want people to stop their scroll for your pin and click through to your site. It’s important to be clear with what the pin is about and include a CTA if possible.
Assess each of those numbers to see how your pins are performing and if you need to make any adjustments to your pin designs and title/descriptions. If you you get a lot of Pin Clicks but low Saves or Outbound Clicks, look at the design of the pin. Is there too much text on it or is the text too small? Maybe you should add or change up your CTA on the pin to get them to click through.
You can also look at Outbound Click Rate. This is your click-through rate (CTR) and is your clicks divided by your impressions. Anywhere between .2-.5% is the average on Pinterest (it varies by niche) so if your CTR is higher than .5%, you are doing great!
As you look at the graph, take note of what days you see more impressions or engagements. Did you implement any new strategies? These are things you want to take note of for reference later on.
Below the graph, you will see “Top Product Groups” (if you have a catalog set up). Otherwise, you will see your top 50 pins followed by your “Top Boards”.
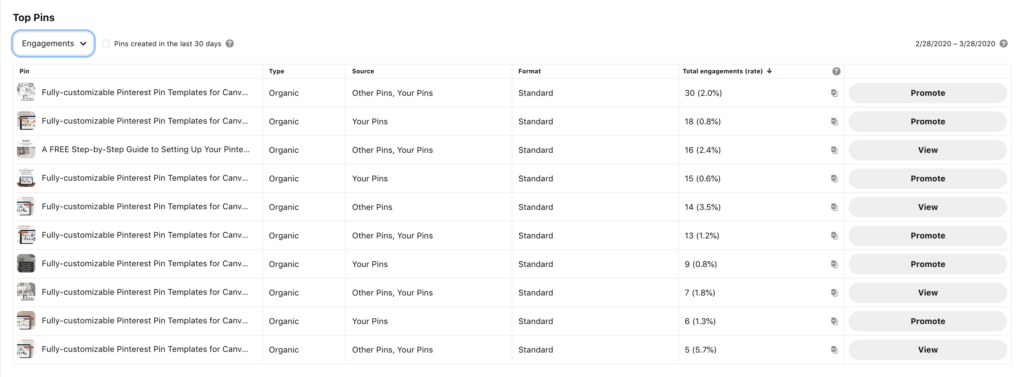
Under the “Top Pins” you will find a goldmine of information. Here is how I use it:

I will filter my pins by “All Pins” or choose to look at one of my claimed domains. These settings can be changed in the “More Filters” section as we did in the beginning. Use the drop-down menu to look at the different metrics (engagements, impressions, etc.). What themes do you see in your pins? Look at the pin design itself as well as the title and description. Is there a dark overlay with light text? Or is it an overall light colored pin? What keywords are you using? Take note of this when thinking of new content to create.
If you see you have a ton of close-ups on your pins, but saves or clicks are low, consider adding a call-to-action (CTA) on the pin and in your description.

In the “Top Boards” section, I look at the impressions and engagements of my boards to see which boards are getting the most reach and performing best. When I create a new pin and want to schedule it to multiple boards, I will pin it to the most-relevant, top-ranked board of mine. I will also, use the board statistics to see what boards my audience is most interested in and I will create additional boards with similar topics and keywords.
Individual Pin Stats
One last thing I like to look at from time to time is my individual pin stats. Click on any of your pins to open it in a new window.

Next, click on “See more stats” and take a look at the history of your pin. With the 2021 stats update, you can now see all of the same metrics that are available in your account analytics overview. If it’s an older pin, has it seen a resurgence in impressions and engagement? If so, create a few new pins for that content or, better yet, create a new blog post with a slightly different angle on that topic. This will help ride the wave of content that is trending.

Below the graph, you’ll see boards that people are saving your pin to. Are they appropriate for what your pin is about? If not, then how can you give more context to the pin? Maybe use a different image or try a text overlay on it. If it is on a relevant board, check out the person who pinned it. It is likely they could be your target audience. If that’s the case, CONGRATULATIONS!

There you have it! I hope this walkthrough has shed a little light on how you can use your Pinterest analytics to help drive your Pinterest marketing strategy!
What questions do you have about your Pinterest analytics? Drop them in the comments below and I will answer them!
Save this post to reference later!


This post may contains affiliate links, meaning that if you choose to click through and make a purchase, I will receive a small commission at no cost to you.
Leave a Reply
close
with code: CYBER20
Cyber week sale!
let's shop!
Take 20% off your purchase
Offer valid through 11:59pm CST on 12/02/2022
Promo code (if applicable) must be entered at checkout. Cannot be combined with other codes or used on the Pinterest Template Bundle. Not valid on previous purchases. Not responsible for forgotten or misused promo codes. Offer subject to change

I’m just starting out with Pinterest marketing and I had no idea you could access individual pin statistics too! This will be super helpful moving forward. Thanks for the tip!!
So glad you found it helpful! I’m happy to answer any other questions you might have!